Water Quality
It’s All About the Water!
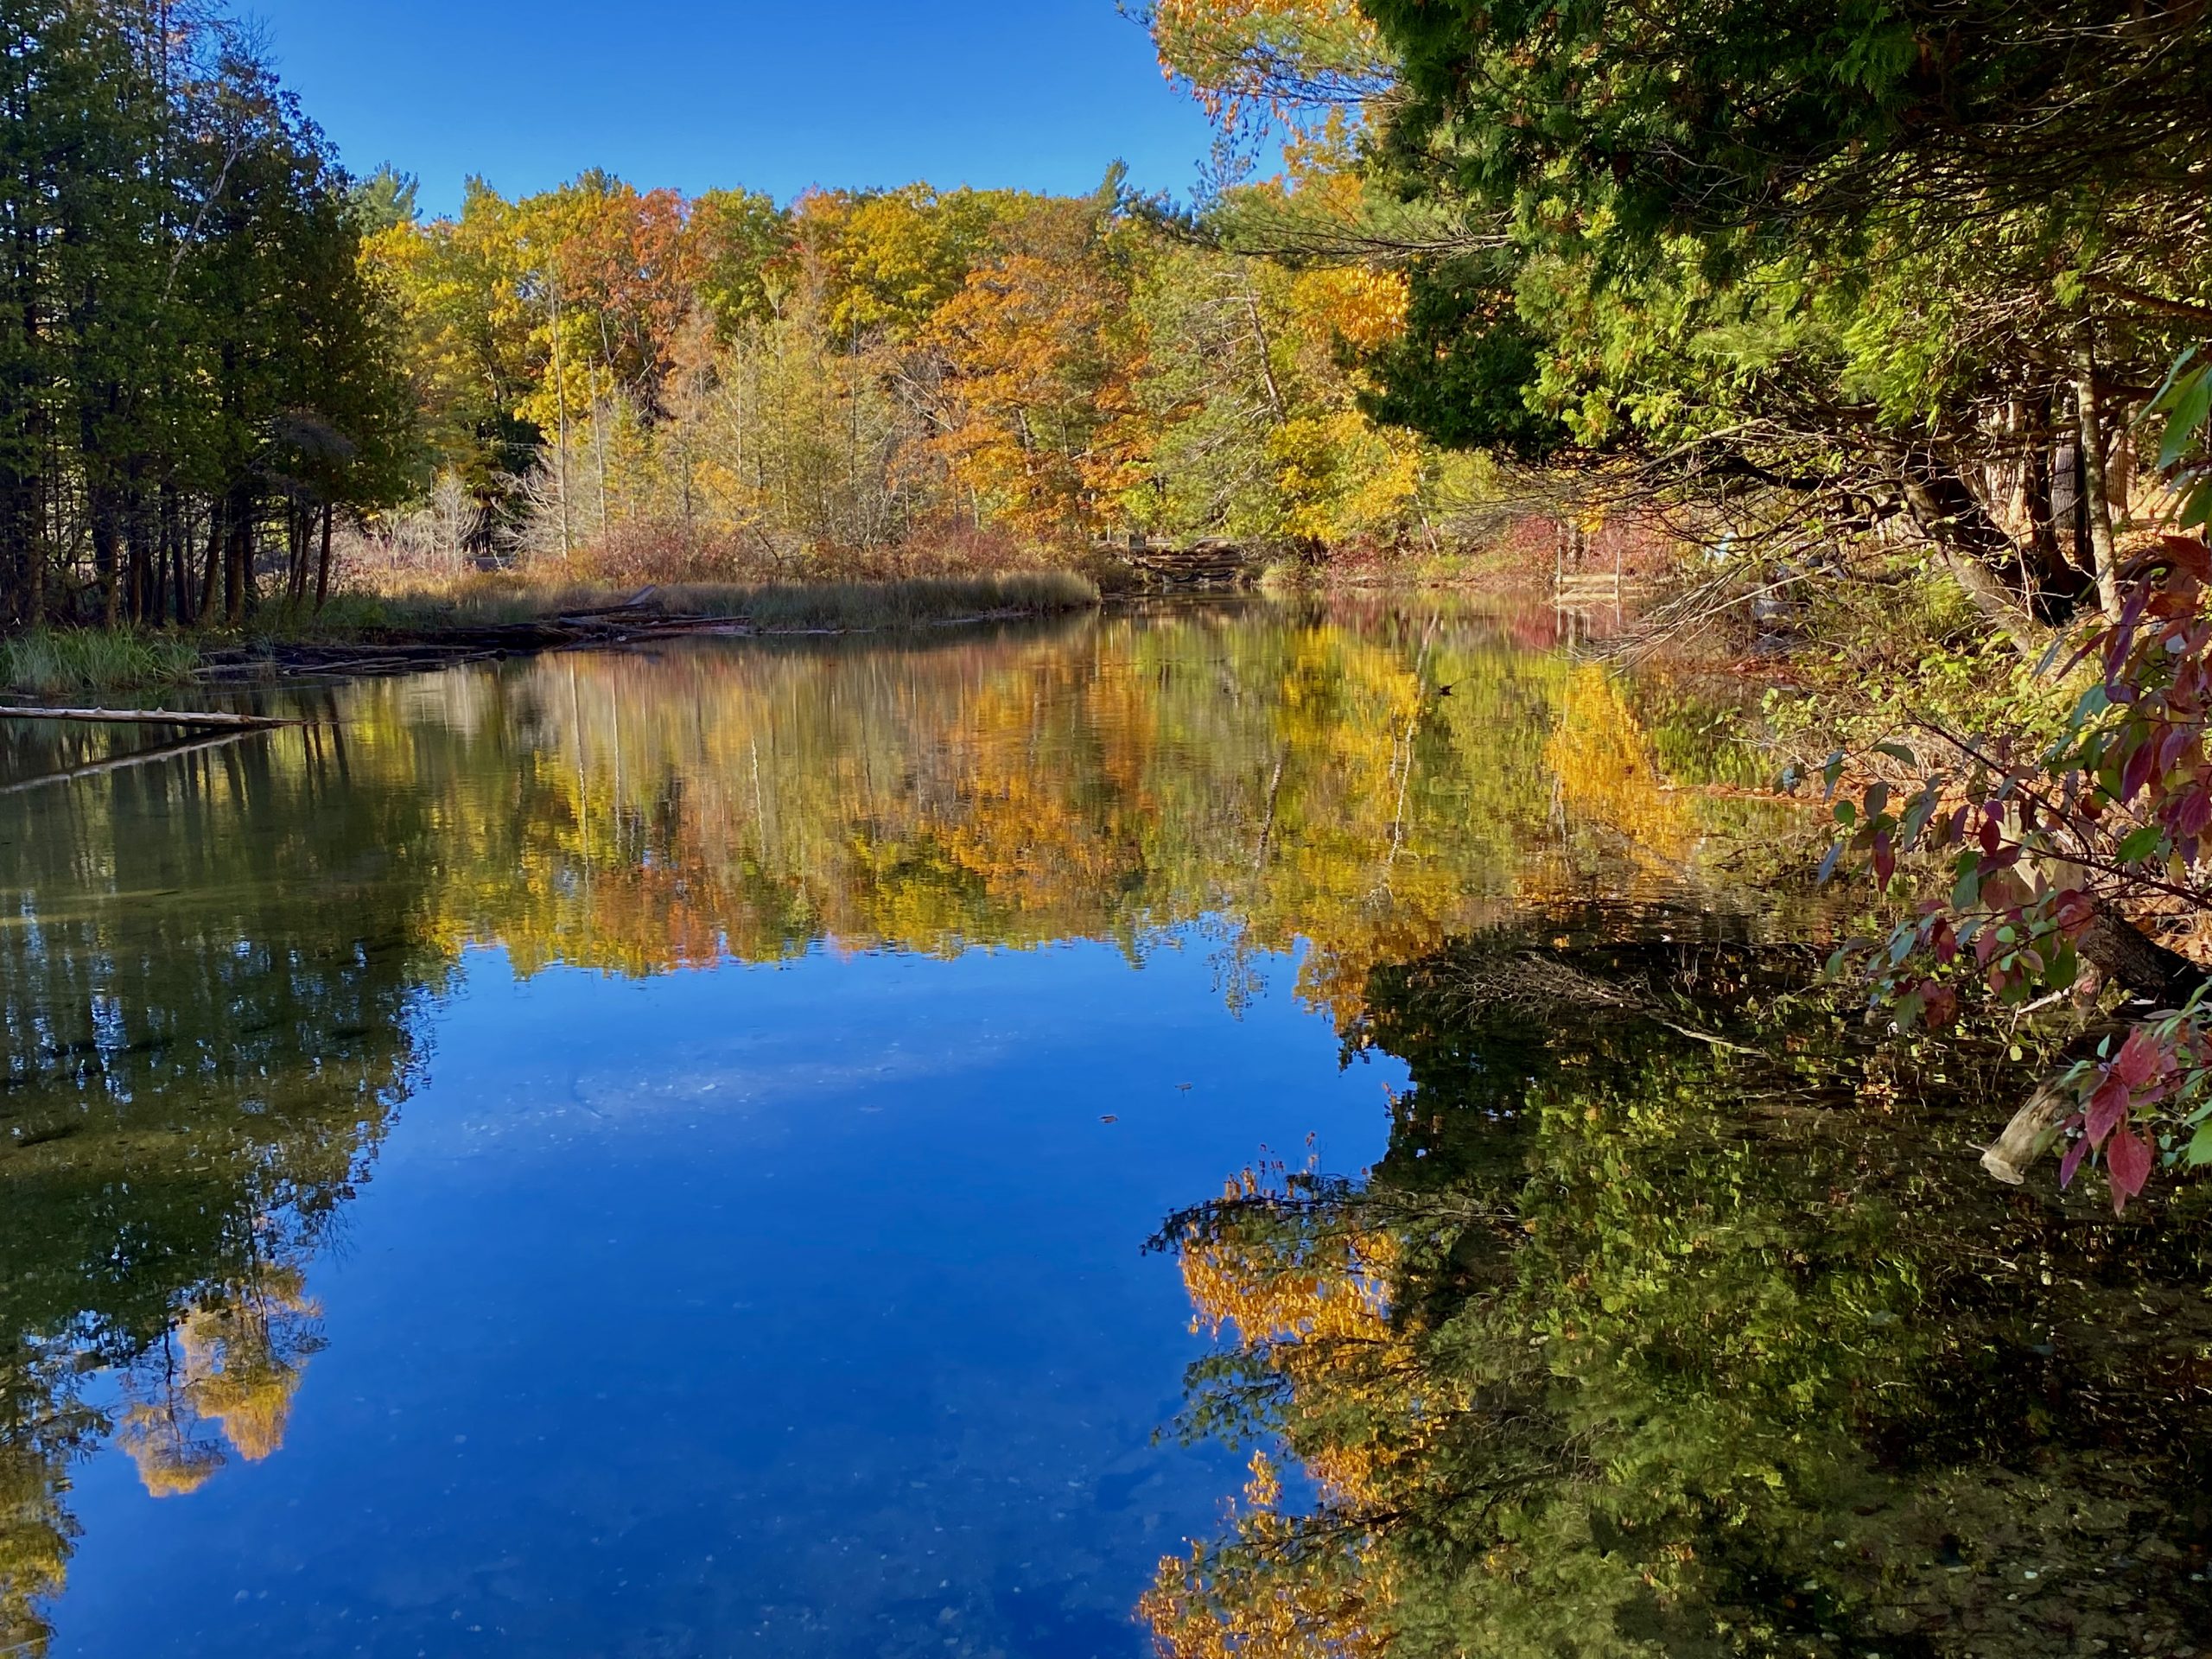
Since the inception of the Glen Lake Association, preservation of the watershed’s exceptional water quality has been our number one priority. We currently enjoy clean healthy water, but this could change quickly. Environmental stressors – such as new development, more year-round residents, and the replacement of small cottages with large homes – threaten the health of our lakes and streams. The Association’s dedication to water quality is more important than ever. We invite you to learn more about what we’re doing to protect the water, as well as what you can be doing too!
What is the glen lake association Doing To preserve Water Quality?
The Glen Lake Association works vigilantly to preserve water quality and to ensure the continued health of our pristine lakes and rivers. Our water quality initiatives include water monitoring and testing, invasive species prevention and management, water quality research, shoreline surveys, and river health “checkups”. We also educate the community – those who live, work, and play on or near the water – about how to be good stewards of the watershed.
WE MONITOR AND TEST THE WATER
Water monitoring and testing is an important part of assessing and tracking the health of the watershed. Monitoring allows us to observe historical trends, note changes over time, and respond quickly to problems when necessary. We use hydrolab technology to measure certain lake and stream parameters year-round including pH, turbidity (i.e. clarity), and temperature. In addition, each week throughout the summer Glen Lake Association volunteers measure water clarity, phosphorus, and chlorophyll-a. This data is used to establish watershed management policies.
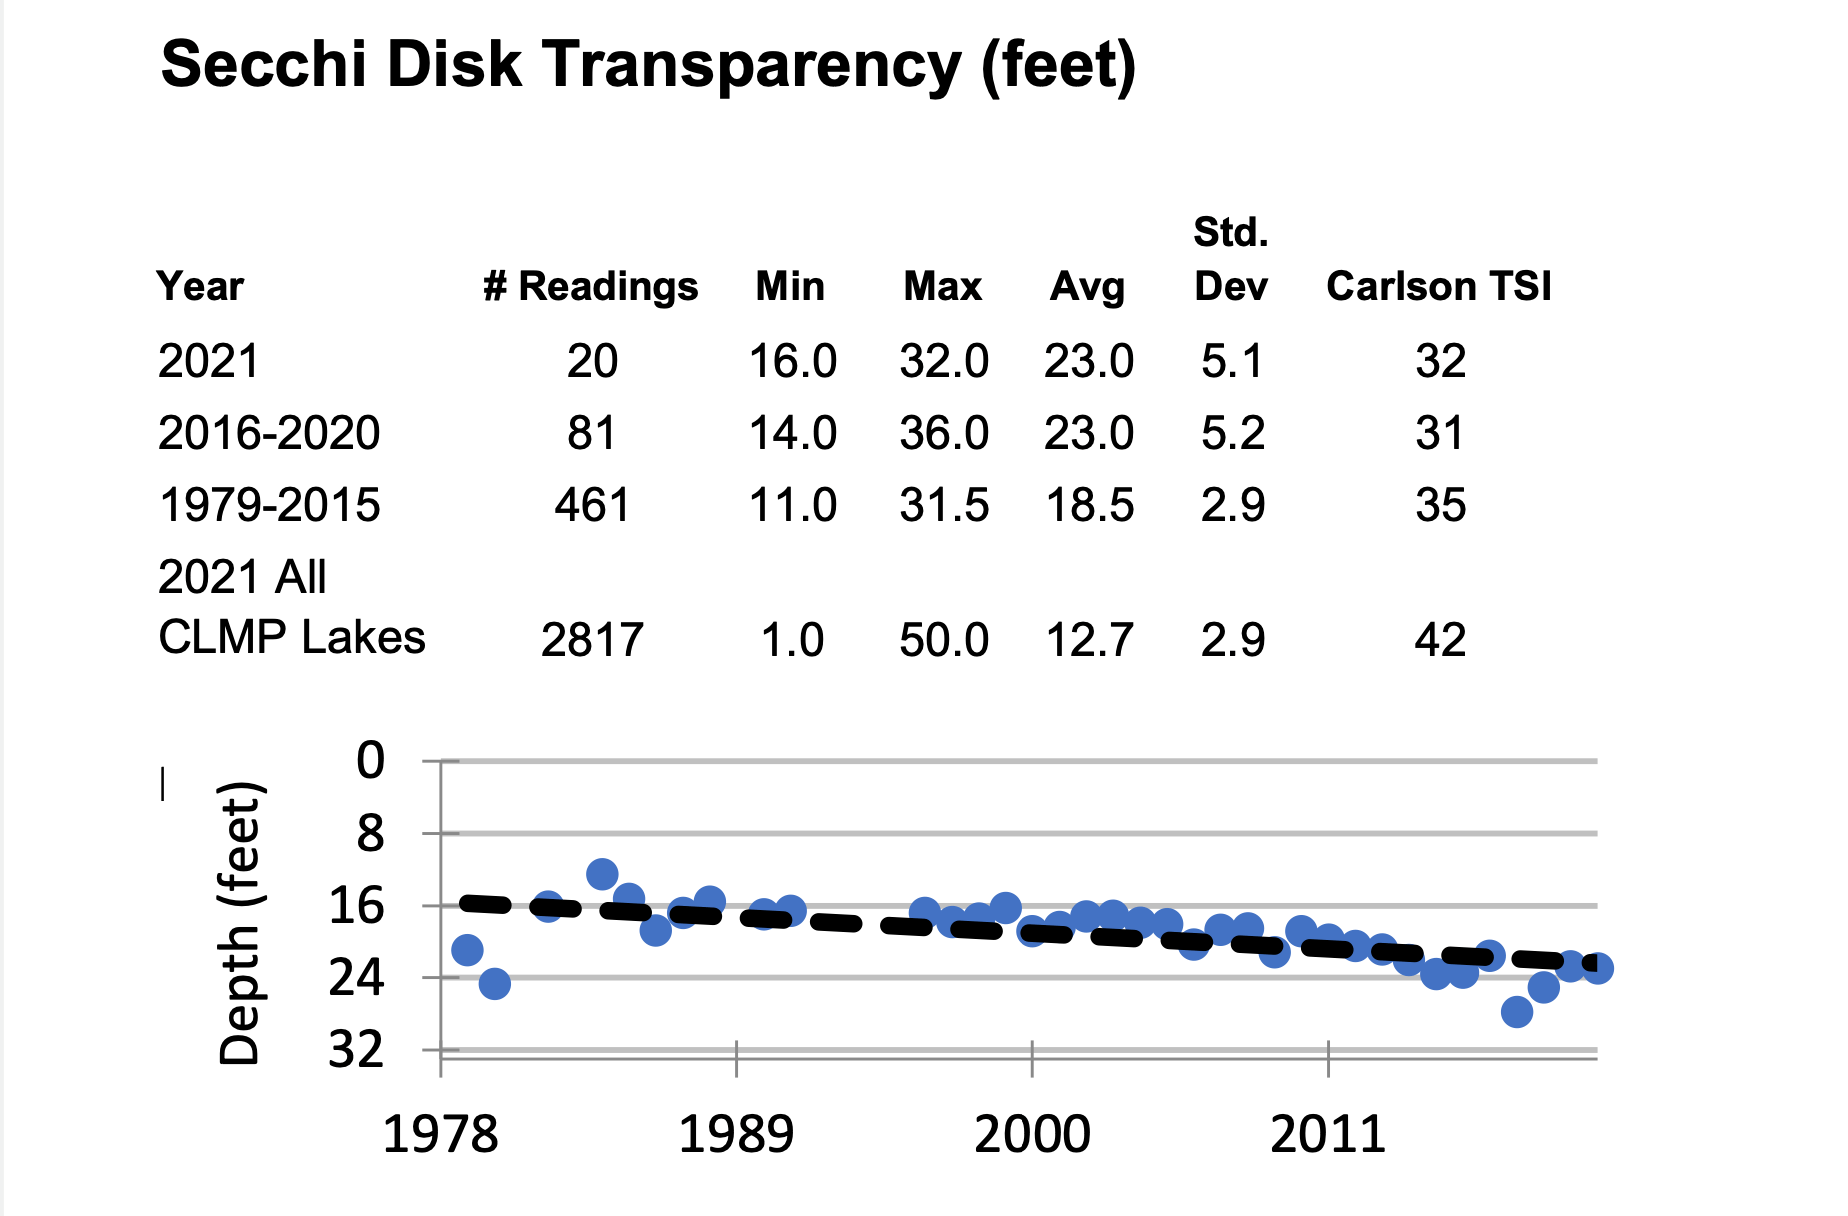
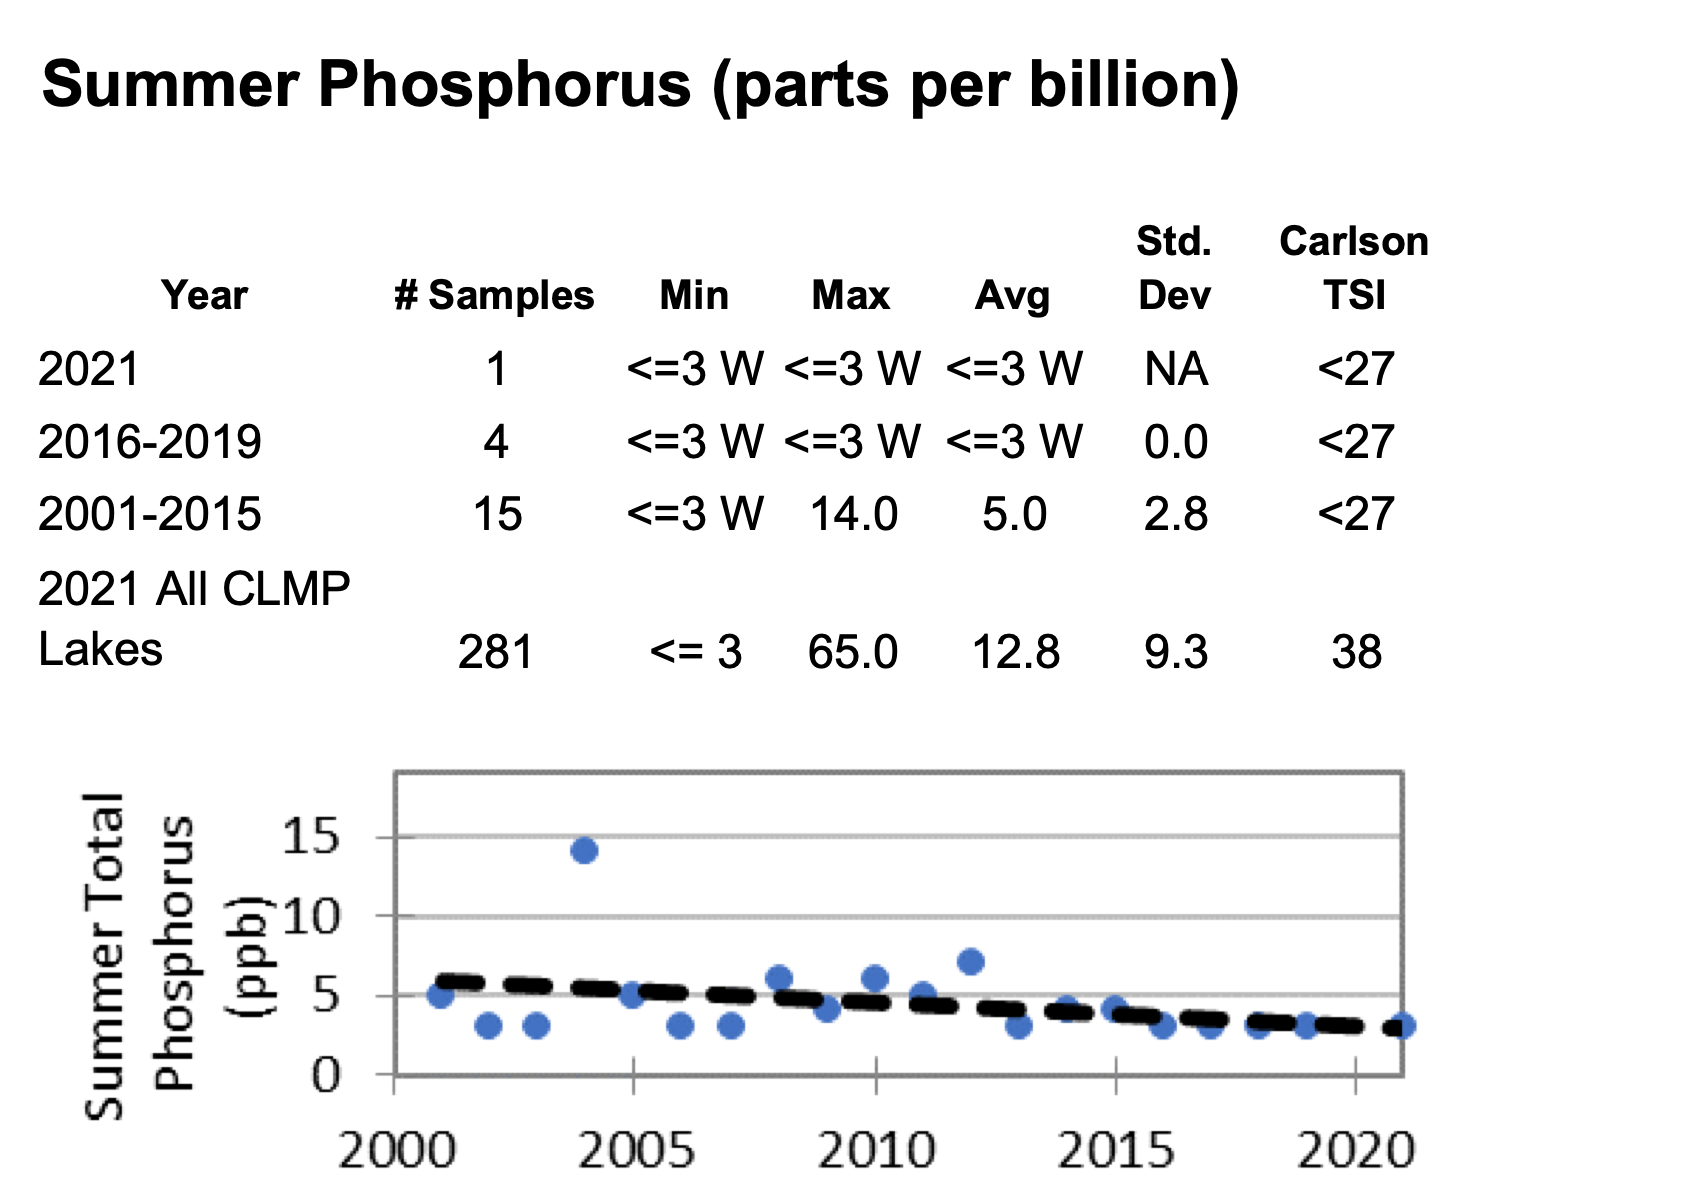
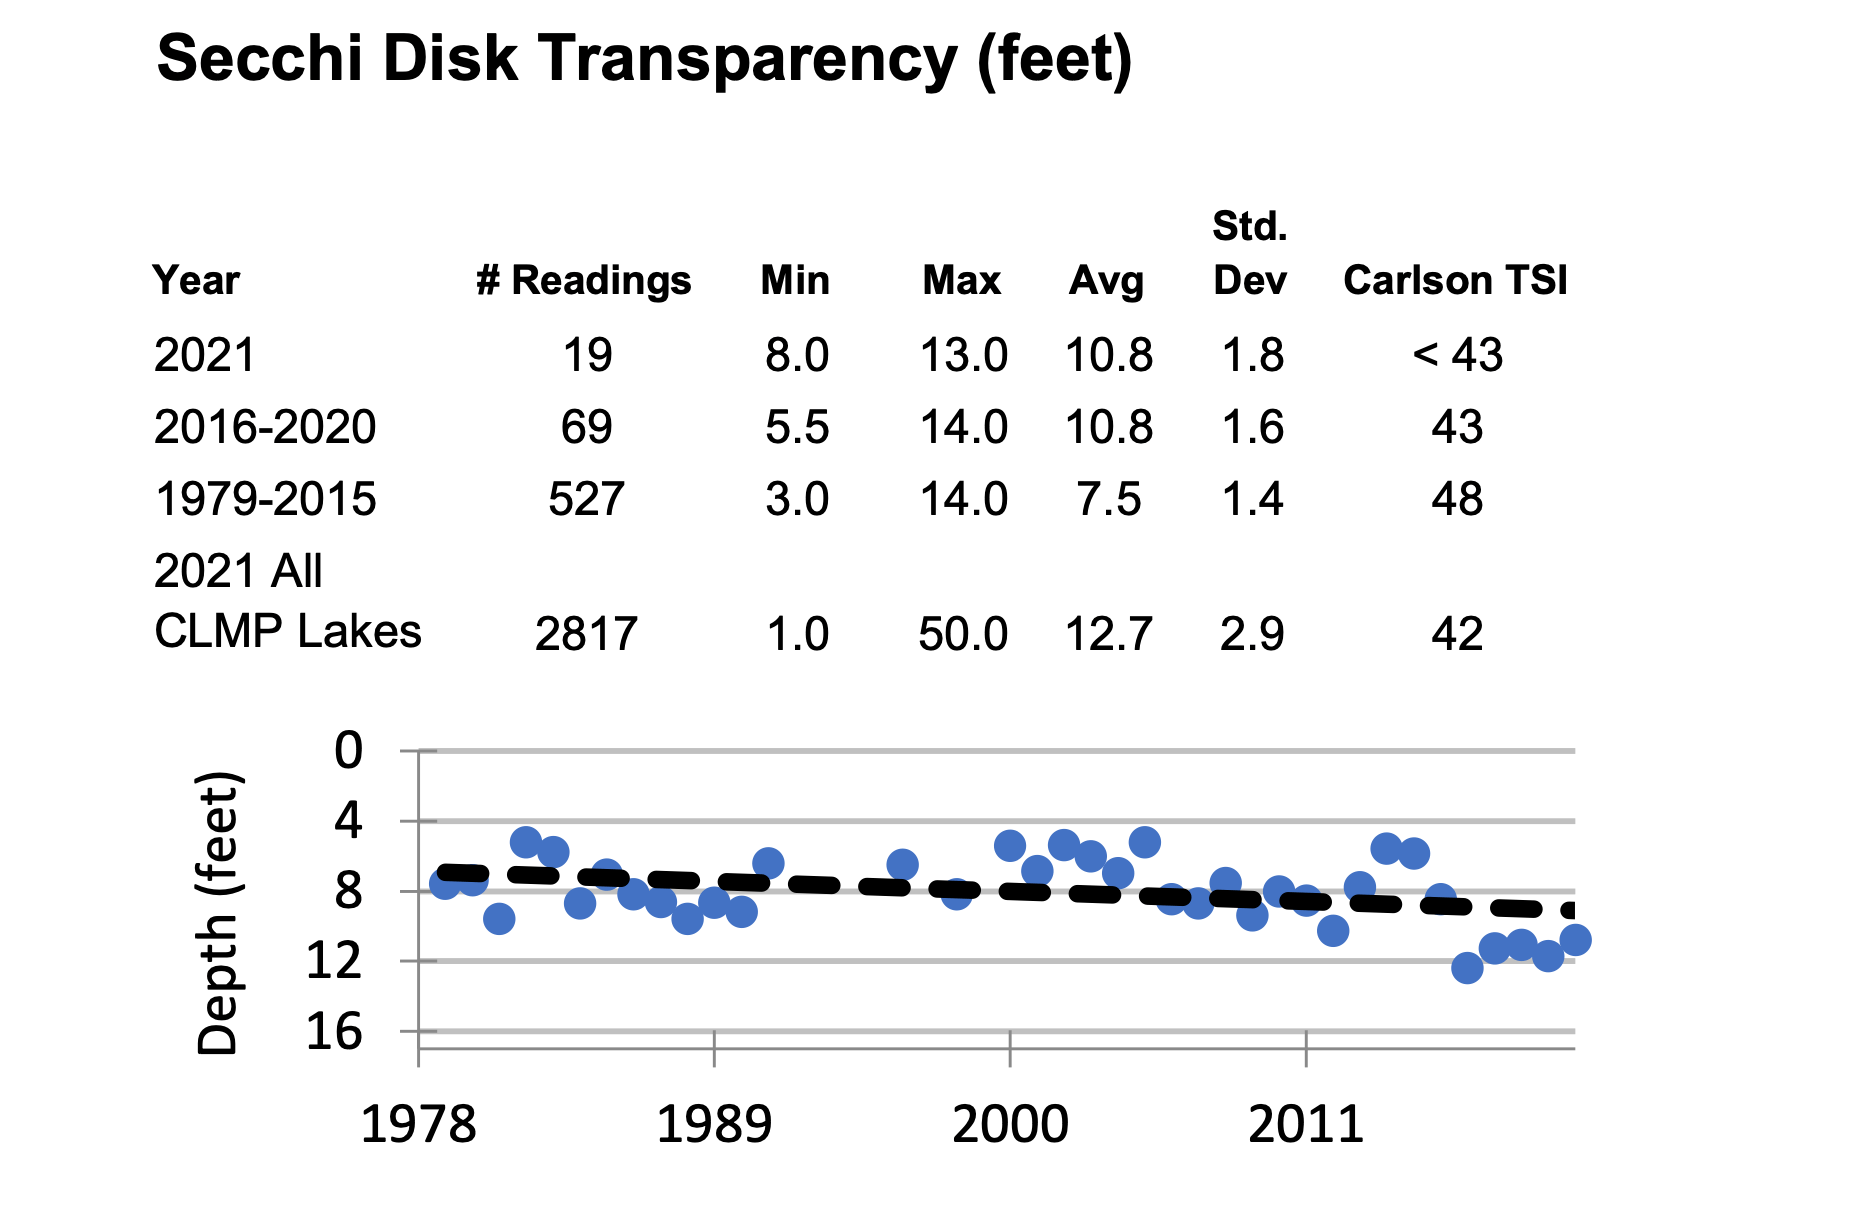
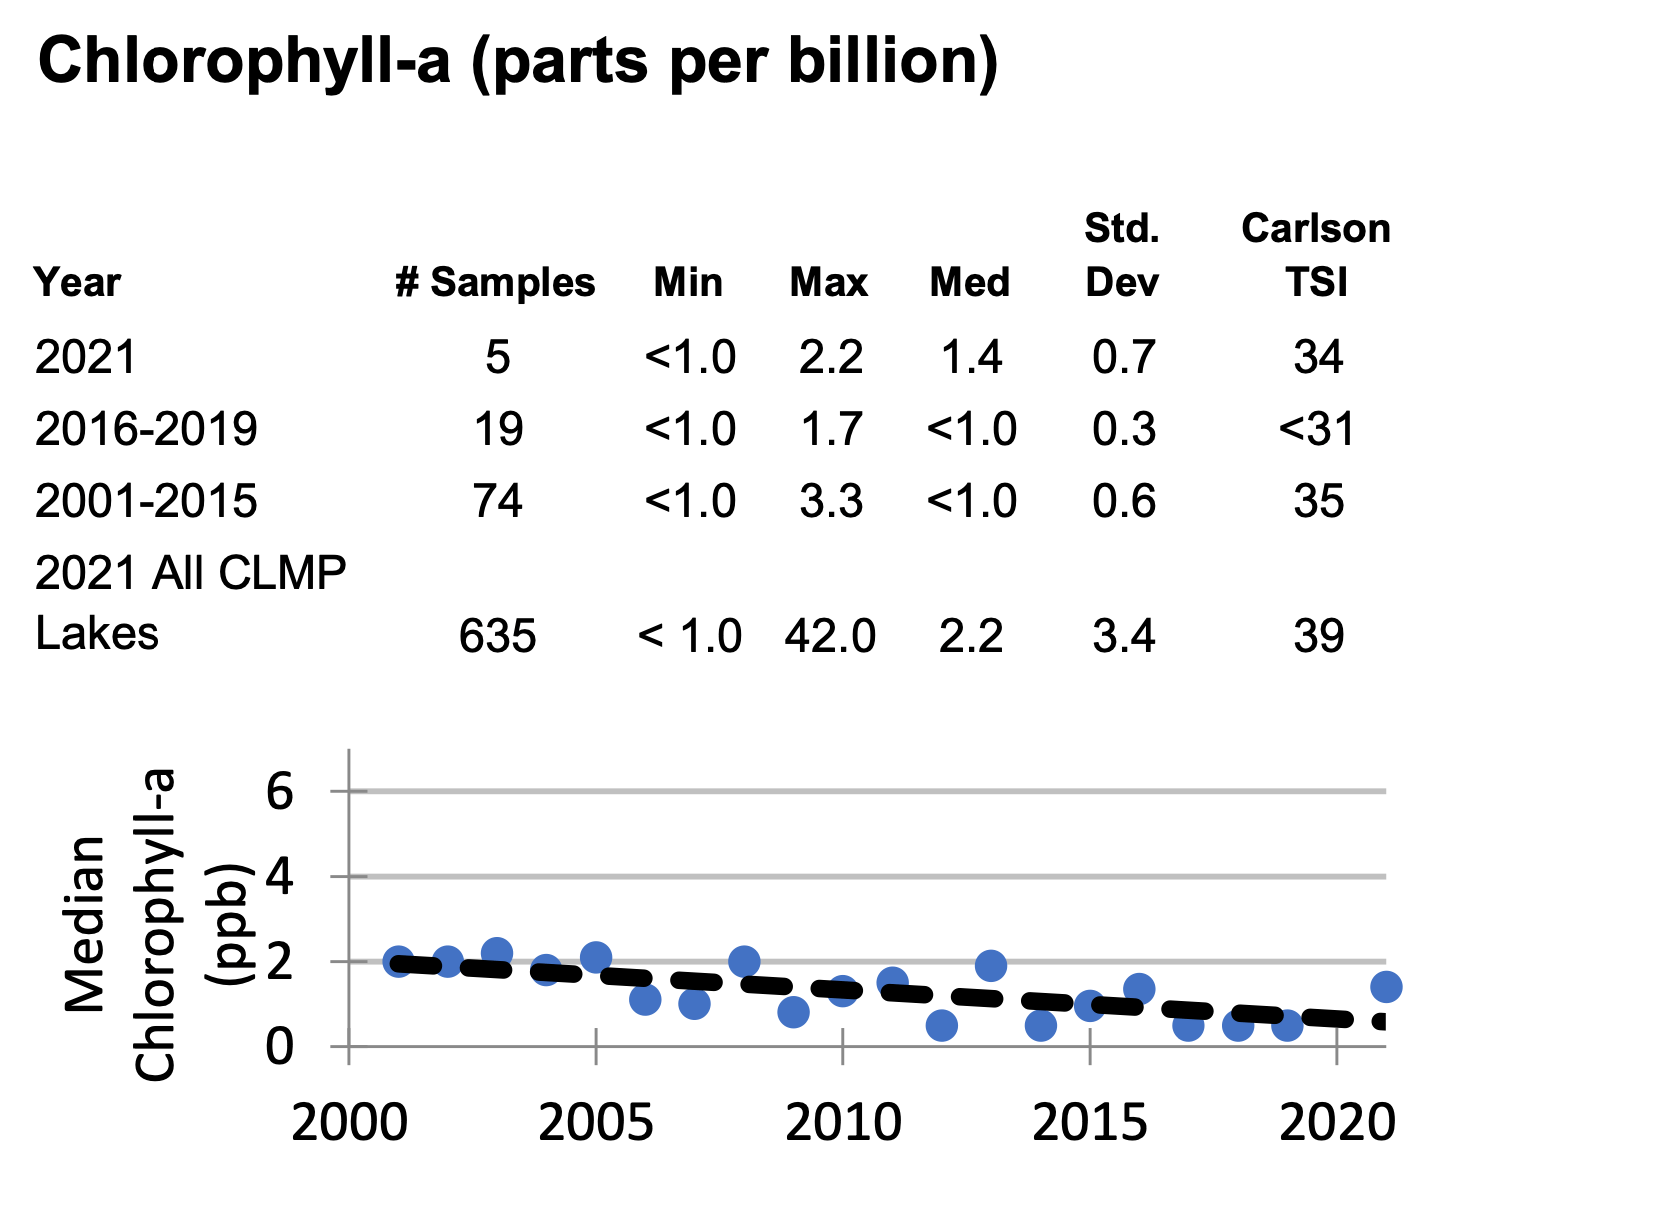
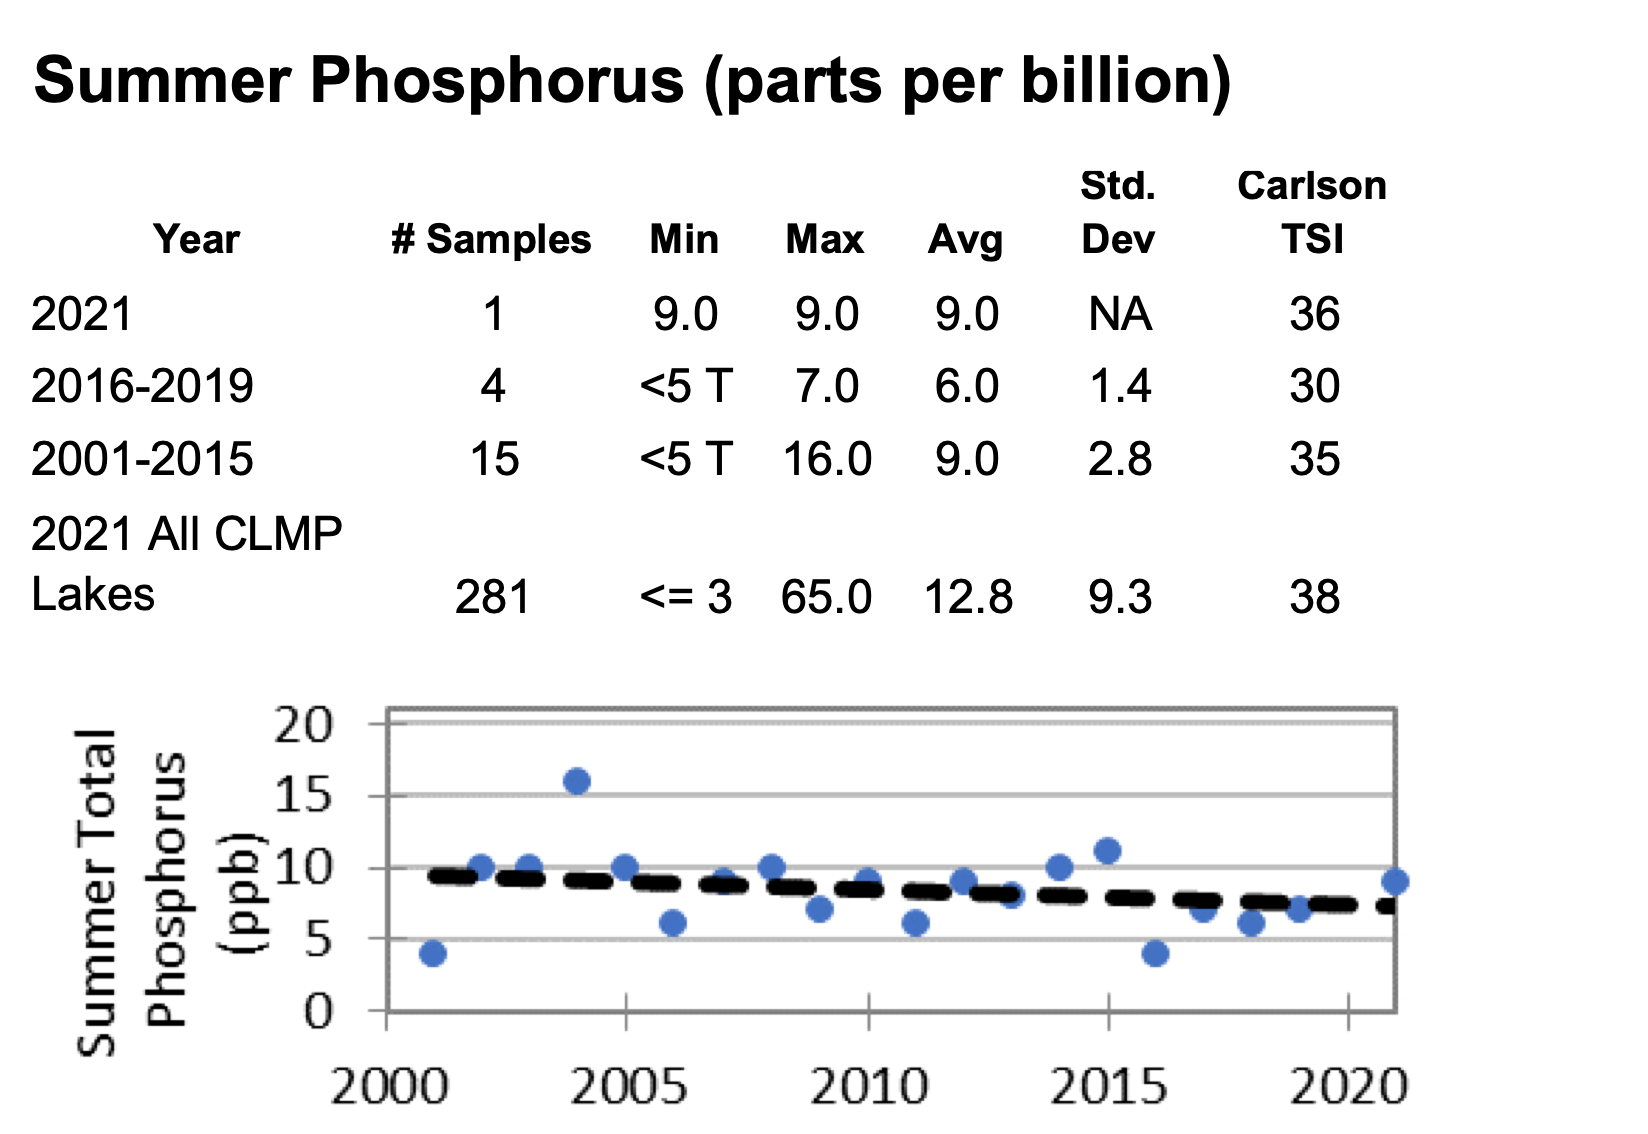
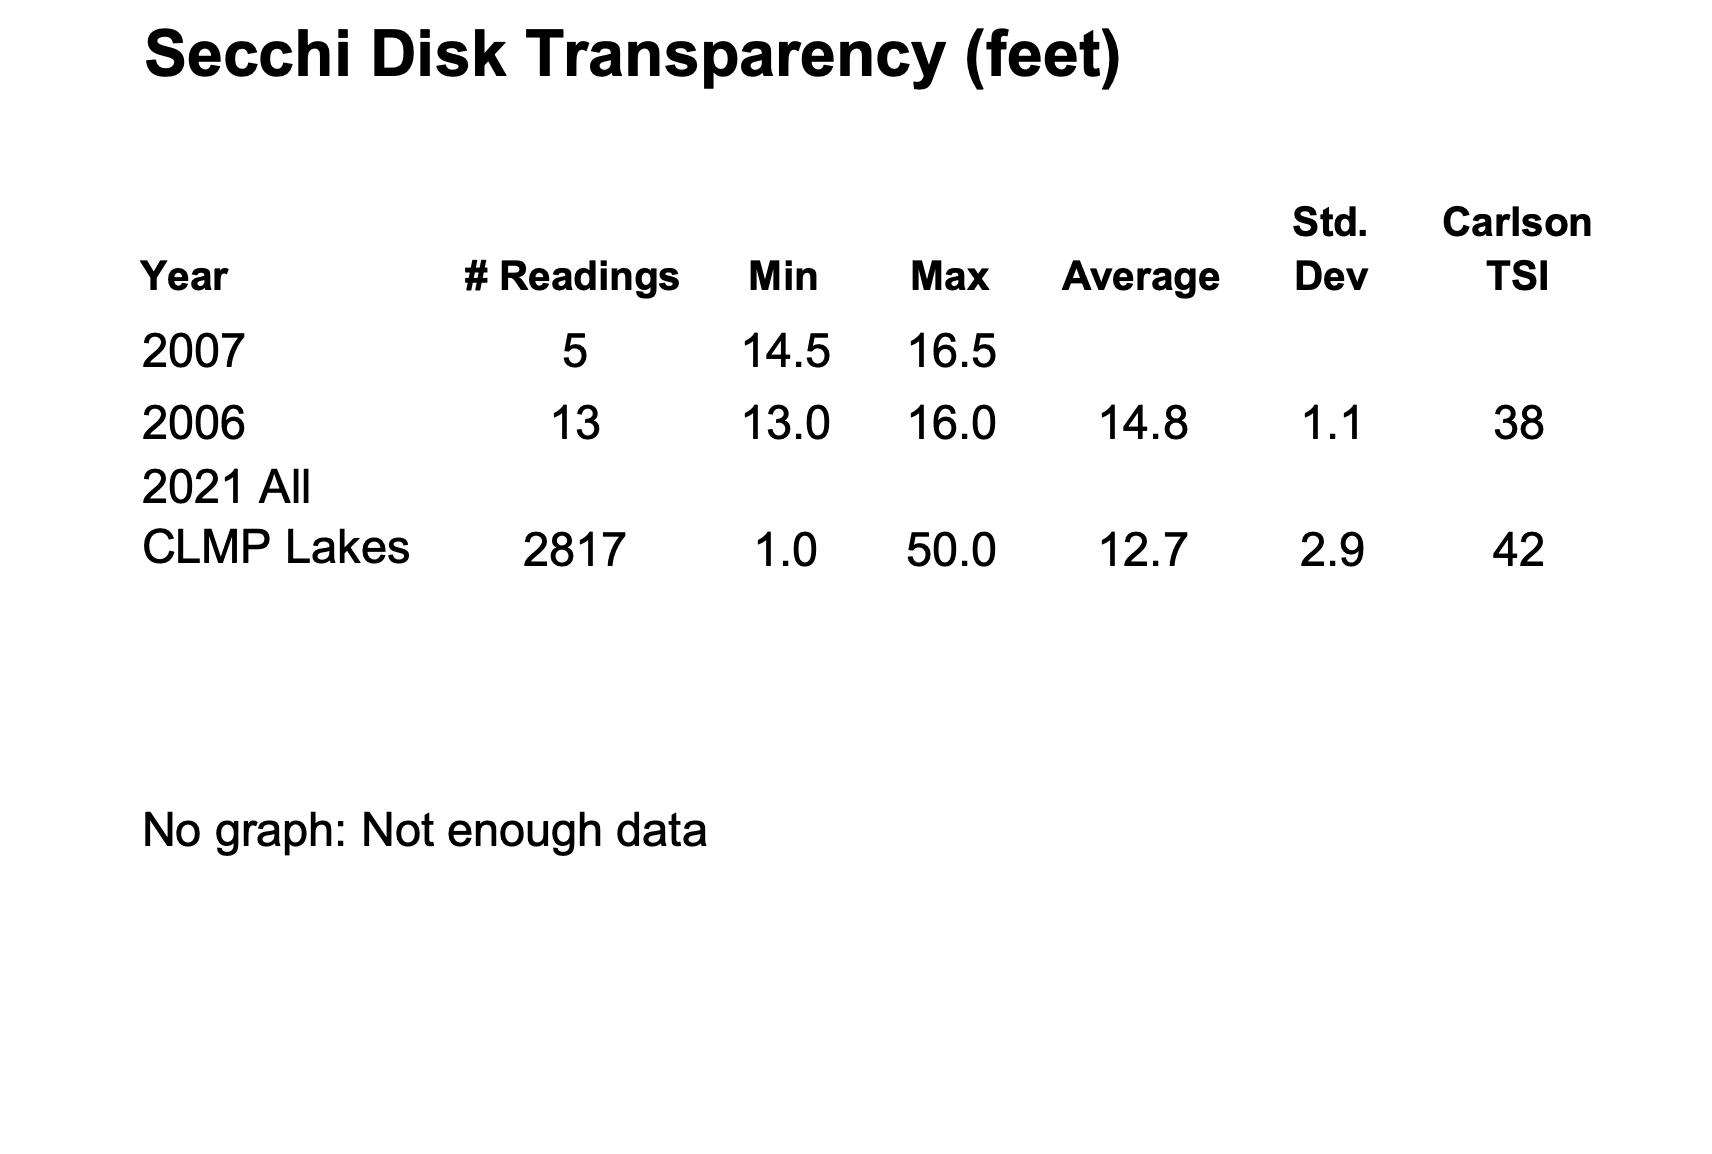
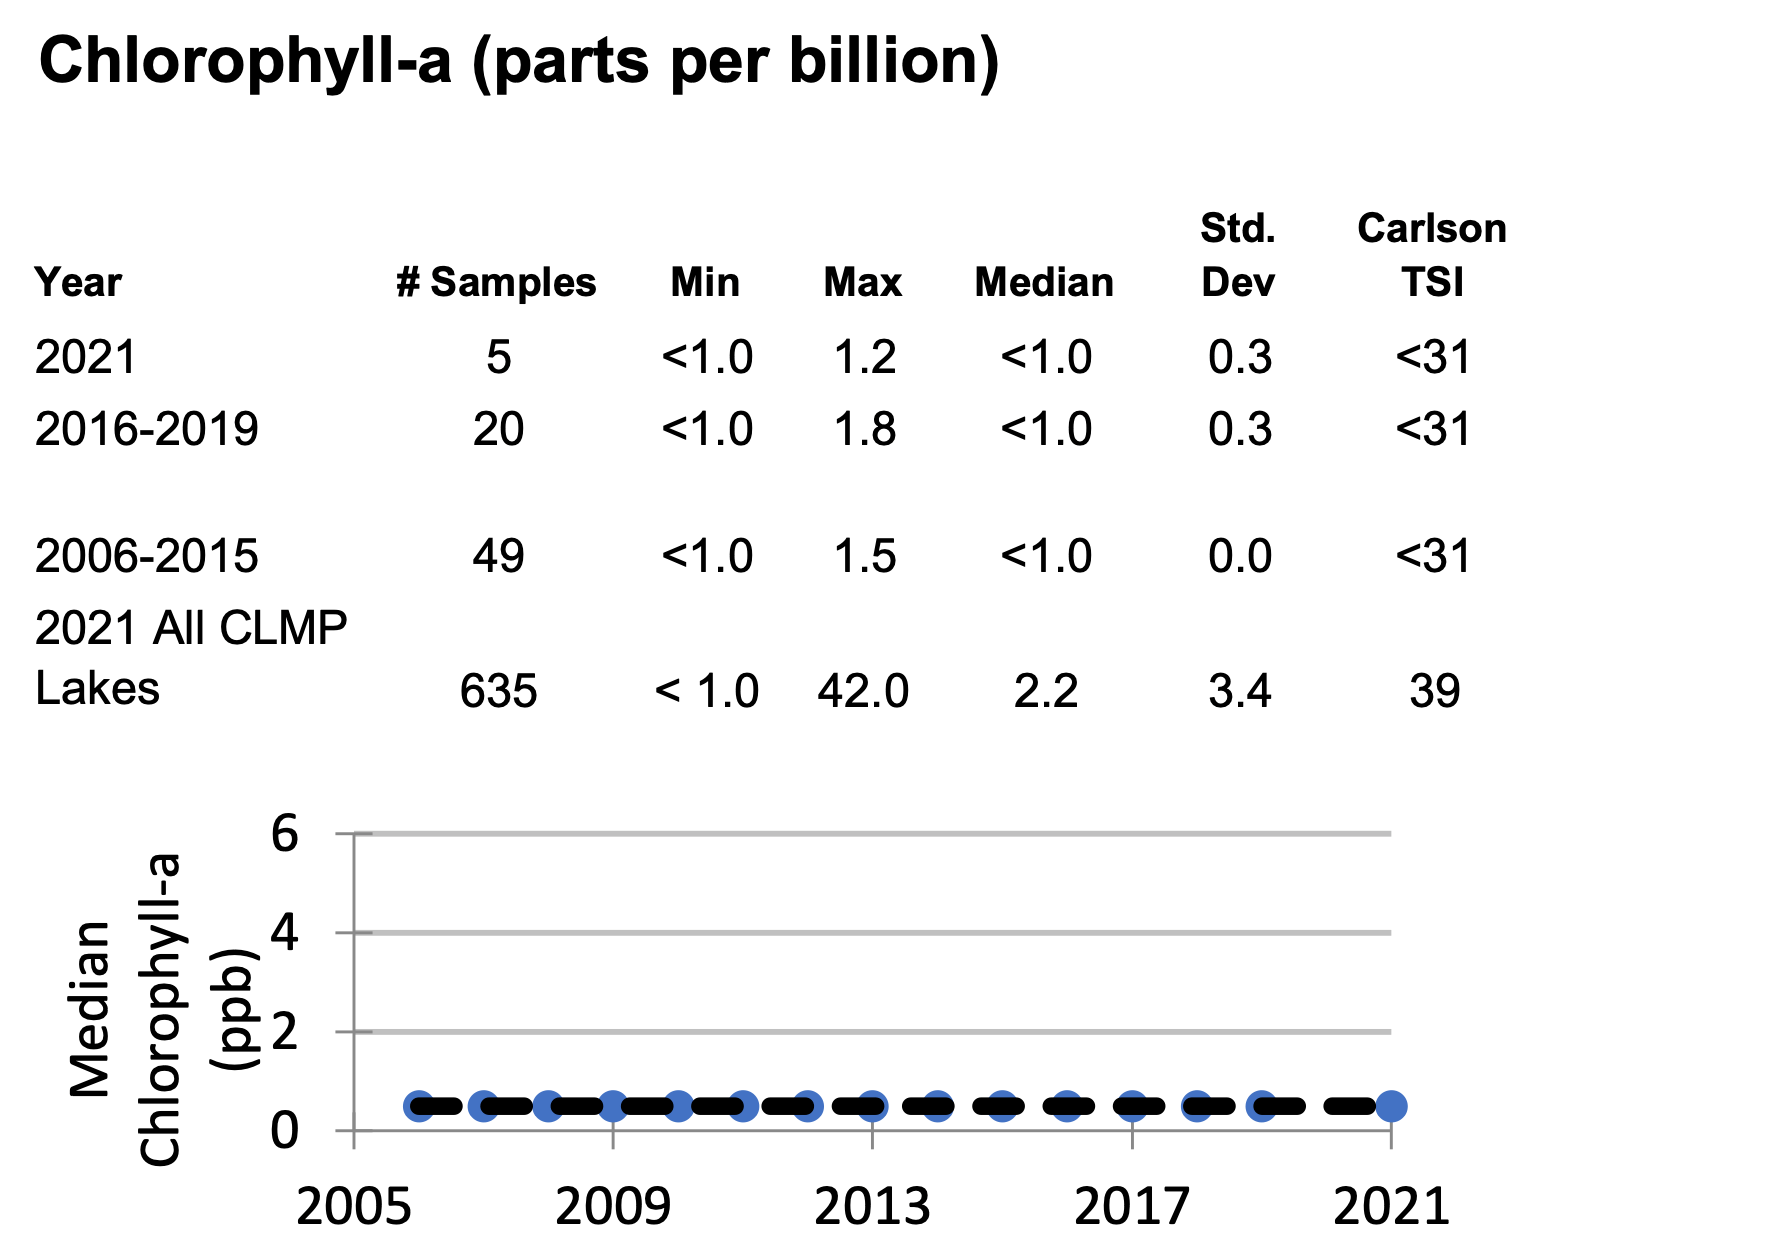
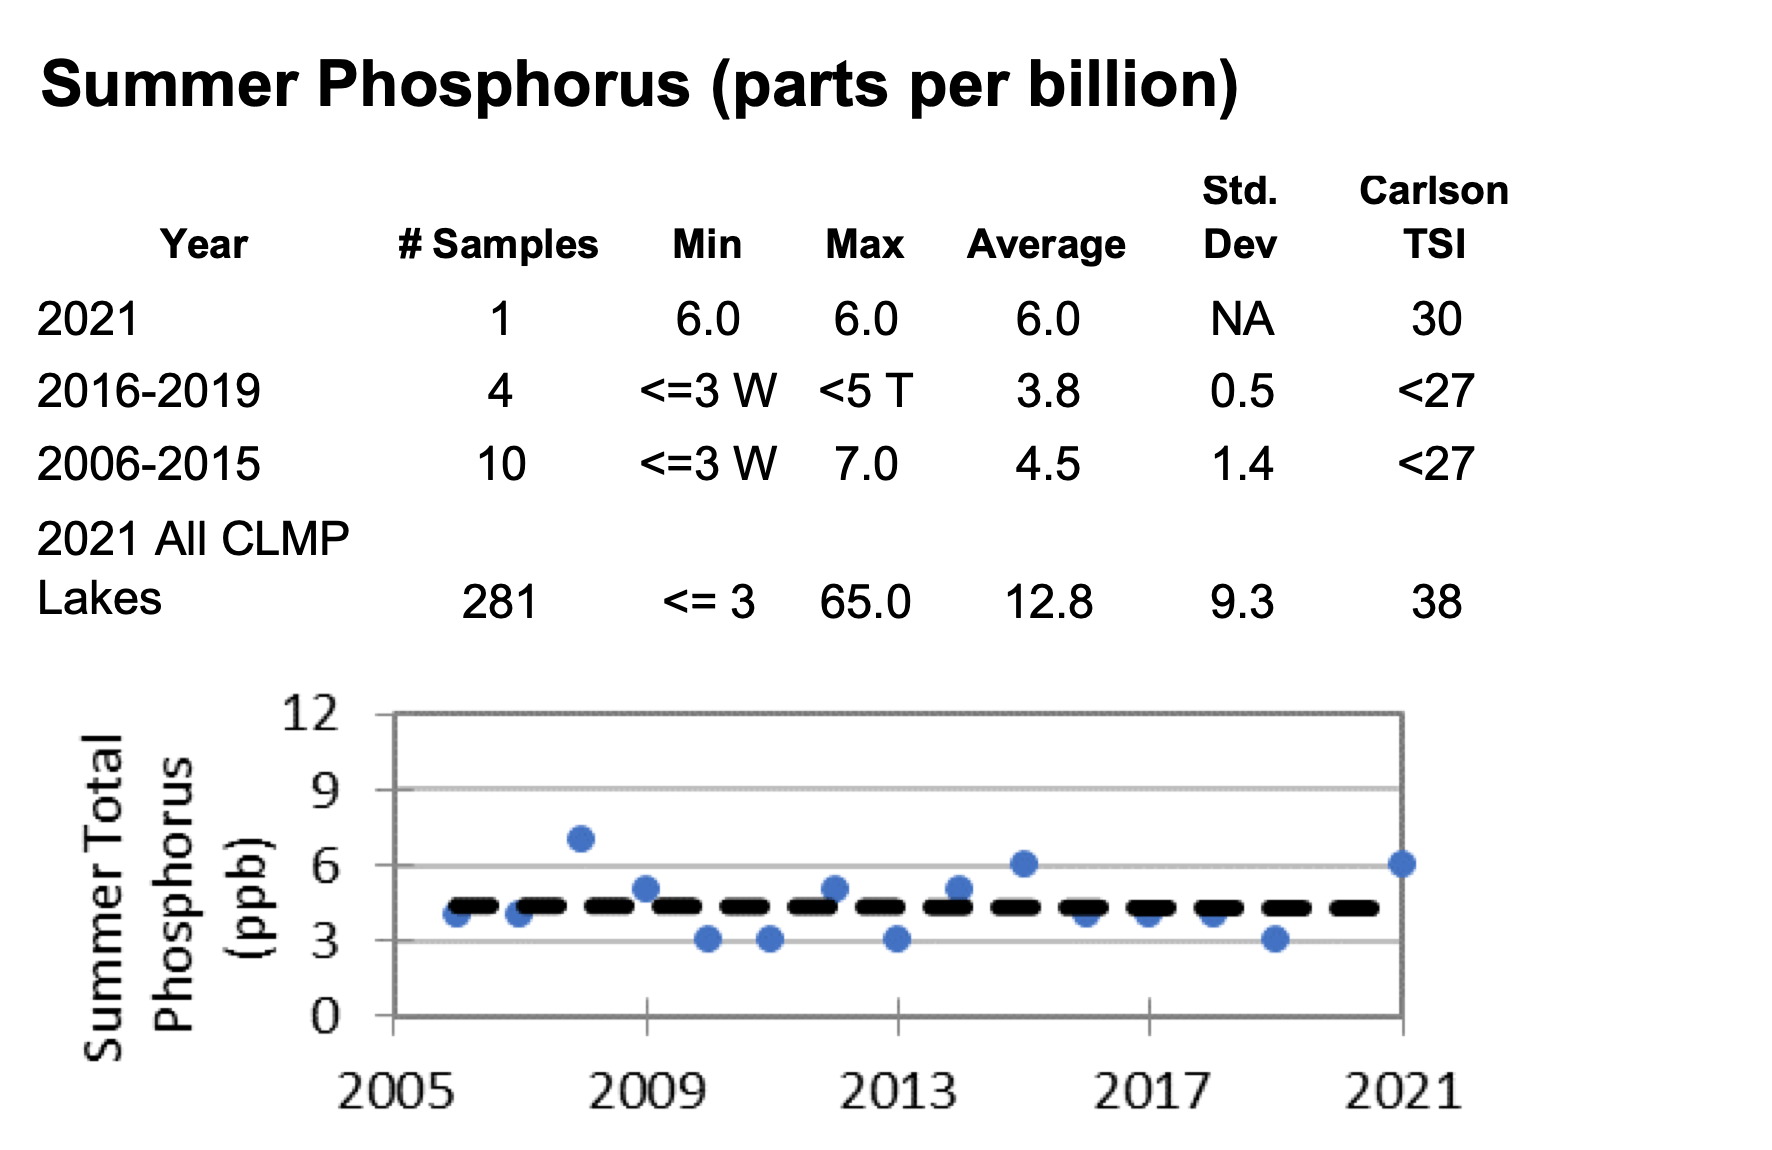
Below you will find a brief description of some of our key water quality metrics, as well as historical graphs depicting a few of these parameters over time for Big Glen, Little Glen, and Big Fisher lakes.
The Science of Water Quality
The lakes of northern Michigan contain clear water for a reason. The well-drained sandy soils which are abundant in the watershed uplands do an excellent job of absorbing harmful chemicals and excess nutrients from stormwater runoff before they can reach the lake water.
Three primary threats to water quality are excess phosphorus, excess nitrogen, and sediments.
Phosphorus and nitrogen are naturally occurring chemicals which act as essential building blocks for living organisms. Sediments are waterborne particles of sand, clay, and plant and animal debris – the basic “stuff” of soil.
While phosphorus, nitrogen, and sediment are important elements of the watershed’s ecosystem, excess quantities of them can negatively impact water quality. Phosphorus and nitrogen happen to be common by-products of normal human activity and waste and are found in everything from food and household products to lawn and garden fertilizers.
KEY WATER QUALITY METRICS
TRANSPARENCY
Transparency (or water clarity) is what gives Glen Lake its beautiful blue color. It is measured using Secchi disk technology. This involves lowering a small plate into the water, determining the depth at which the plate is no longer visible, and establishing a numerical rating. Secchi disk measurements vary throughout the year with greater depths generally observed in spring and fall.
CHLOROPHYLL – a
Chlorophyll is a naturally occurring nutrient found in plants and is a necessary element for photosynthesis. As with phosphorous, excessive amounts of chlorophyll stemming from fertilizer runoff and septic system leachate will negatively impact water quality. Chlorophyll concentrations are an indication of the presence of algae – less chlorophyll generally means less algae and higher water quality. Chlorophyll readings throughout the watershed remain low and steady.
PHOSPHORUS
Phosphorus is an essential nutrient for plants and animals and is beneficial in the right quantities. But, excess phosphorus in a lake or stream over-stimulates the growth of aquatic weeds and algae. This can lead to water quality degradation. Excess phosphorus comes from commonly used products (such as fertilizer, shampoo, and detergent) which make their way into the watershed via rainwater run-off, septic leachate, and wind.
conductivity
Hydrolab probe technology monitors a number of lake and river waters. Measurements of temperature, dissolved oxygen, electrical conductivity, turbidity, and pH are recorded every two weeks between the first thaw and November. Conductivity readings, in particular, are used as an indication of water quality. If the conductivity readings of water in a deep basin are significantly different from the readings of water near an inlet, it may indicate the presence of a pollution source.
We prevent and manage Invasive Species
The Glen Lake Association regularly inventories the location, type, and density of invasive aquatic and plant species in the lakes and along the shoreline. If left unchecked, invasive species can spread quickly causing great damage to the watershed ecosystem. When we observe the presence of an invasive species, a plan is developed and executed for its control or eradication. The Association also operates a boat wash station during the boating season to prevent invasive species from entering the lake via watercraft.
Learn more about this crucial component of our water quality program
We perform Shoreline Surveys
The Glen Lake Association periodically conducts shoreline surveys to evaluate the potential impact of riparian shoreline practices on the health of the lake. Using drone technology and mapping software, we note trends in the existence and location of certain shoreline characteristics or conditions including: greenbelts, drainage pipes, sea walls, rip rap, erosion, fish habitat, lake-water irrigation, road ends, inlets, and invasive plants. The surveys conducted establish a baseline for trends over time and enable us to stay abreast of shoreline conditions which could negatively affect water quality.
Learn more about best practices for shoreline and stream bank management
We Perform crystal river Health “Checkups”
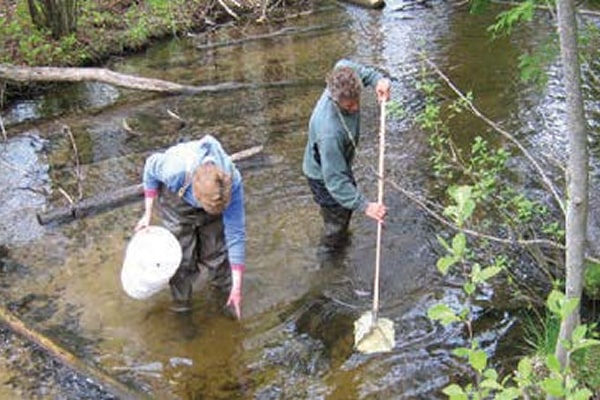
Healthy river ecosystems typically support fragile insect species and have significant species diversity. Unhealthy rivers, on the other hand (which are subject to environmental stressors or pollution), lack fragile species and have low species diversity. The Crystal River health checkups performed by the Glen Lake Association look for the presence of certain aquatic insects, indicating good water quality. Past evaluations have found the river to be in good health, and we hope future surveys will continue to do so as well!
Are you familiar with the Crystal River Dam? Learn how the dam is used to balance the level of Glen Lake with the flow of the Crystal River
We Conduct water quality Research
case study: rain events & E. coli
The Glen Lake Association studied the effect of rain events on E. coli levels at the mouth of Hatlem Creek. Surface grab samples collected from three different locations were analyzed to determine how long elevated E. coli levels would persist after a significant rain event. The results indicated a high correlation between the color of the water and the presence of E. coli. The browner the water, the higher the E. coli levels. Typically after a day or two, the water turned clear again and E. coli levels reduced significantly.
Learn more about Hatlem Creek as well as the other bodies of water within our watershed
case study: Septic System bacteria
In conjunction with Freshwater Solutions LLC, and the University of Alberta Canada, the Glen Lake Association conducted a three-year study of septic system influences on surface water (lakes and streams) and well water. This multi-year, multi-lake study used a cutting edge real-time PCR technique to detect and quantify enteric bacteria which may be entering the water from septic systems. In addition, the study used drone technology and infrared cameras to perform septic drainfield analysis.
Learn more about how to care for your septic system and promote a healthy watershed
WHAT CAN YOU DO TO PROTECT WATER QUALITY?
- Avoid the use of phosphorus-based fertilizers (See Landscaping & Lawncare)
- Avoid household products, such as shampoos and detergents, containing phosphorus (See Lake-Friendly Products)
- Control stormwater runoff (See Impervious Surfaces)
- Keep shorelines and streambanks natural (See Shoreline & Streambank Preservation)
- Properly maintain your septic system (See Septic Systems)
- Never attempt to treat aquatic weed beds on your own, Contact Us!
water quality & lake productivity
How do our lakes measure up?
All lakes can be characterized in terms of their biological productivity, or the amount of living material they support (i.e. algae). Lake productivity is measured using the Trophic Status Index, or TSI. Trophic refers to the feeding habits of different organisms in a food chain or food web.
Over time, lakes slowly fill from the bottom up with sediment and accumulate nutrients from thousands of generations of plants and animal life. This process is known as eutrophication. Eutrophication is the natural aging process of water bodies which takes place over many decades. This aging process accelerates dramatically when human populations move into a lake watershed. Why? Because our normal activities upset the ecological balance of the watershed by loading nutrients into the system at a faster pace.
TSI is measured on a scale from 0 to 100. Ideally, a lake should have a TSI of less than 40.
oligotrophic lakes
The least productive lakes are termed oligotrophic and are desirable because of their excellent water quality. Yet, the quality is highly susceptible to degradation from nutrient concentrations, namely phosphorus and nitrogen. Big Glen (TSI= 30), Little Glen (TSI=38), and Fisher Lake (TSI=31), are considered oligotrophic.
Mesotrophic lakes
Lakes with a trophic status which falls between oligotrophic and eutrophic are termed mesotrophic. Although Little Glen is currently classified as an oligotrophic lake, it is very close to becoming mesotrophic.
Eutrophic Lakes
Lakes characterized by high nutrient concentrations are termed eutrophic. Eutrophic lakes are the most biologically productive. The higher nutrient levels present in eutrophic lakes cause algal growth, cloudy water, and low dissolved oxygen levels. Tucker Lake, Brooks Lake, and Mill Pond are examples of eutrophic lakes.
Did you know?
The Glen Lake Association employs a watershed biologist on staff. Learn more about our organization
Check out our blog, the Watershed Wire, to get up to speed on hot topics within the watershed
